Extracting Activity History from PowerShell Process Dumps
Imagine that you’re investigating the compromise of a system. The system doesn’t have PowerShell Logging enabled, but you did capture a process dump while activity was happening.
This memory dump is forensic gold, and the managed code debugging extension for WinDbg (“SOS” – Son of Strike) gives you all the tools you need to mine it. After using File | Open Crash Dump, this is what you see:
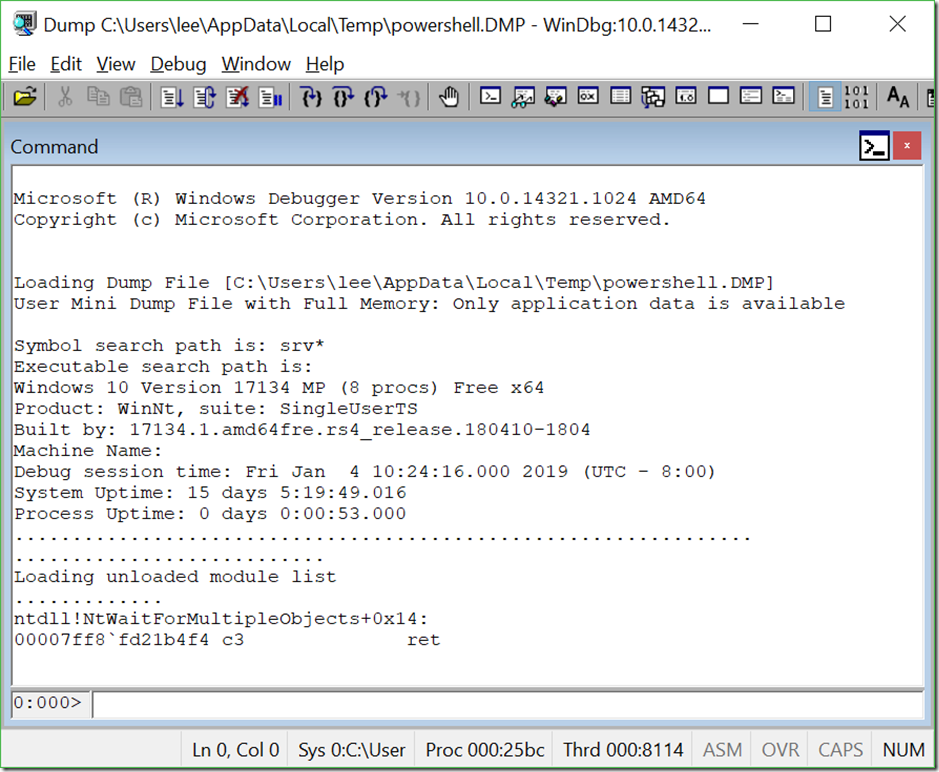
From there, load the SOS extension, fix symbols, and reload:
.loadby sos clr
.symfix
.reload
Use !Help to see all of the features offered by the SOS CLR Debugging Extension, but one useful one is !DumpHeap. It enumerates all of the objects in managed memory, and lets you filter these by type.
PowerShell stores command history in HistoryInfo objects, so lets look for those. We can use !DumpHeap –Type HistoryInfo for this. SOS sometimes generates an exception the first time you use it, so just do it again :)
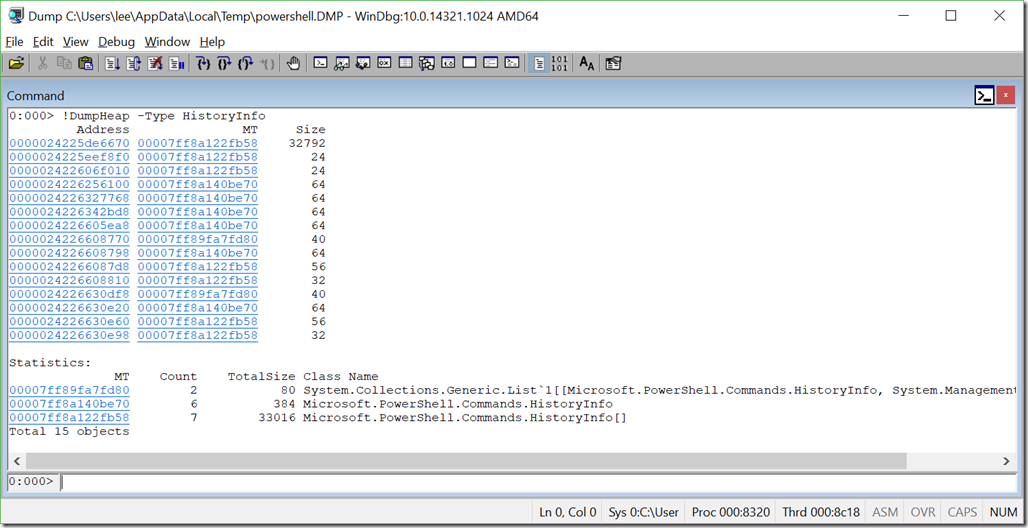
We can see that there were 6 items of HistoryInfo (commands typed by the attacker), and 7 arrays of HistoryInfo (internal data structures that hold them). The heap includes objects that are temporarily in use, so not all of these represent unique commands.
If we click on the MT column for HistoryInfo itself, we’ll get that type of object explicitly. Then, we can click on any of the Addresses to see what that HistoryInfo contains. Clicking is just a shortcut for the commands that WinDbg ultimately shows in the output anyways: !DumpHeap /d -mt 00007ff8a140be70 and !DumpObj /d 0000024226256100.
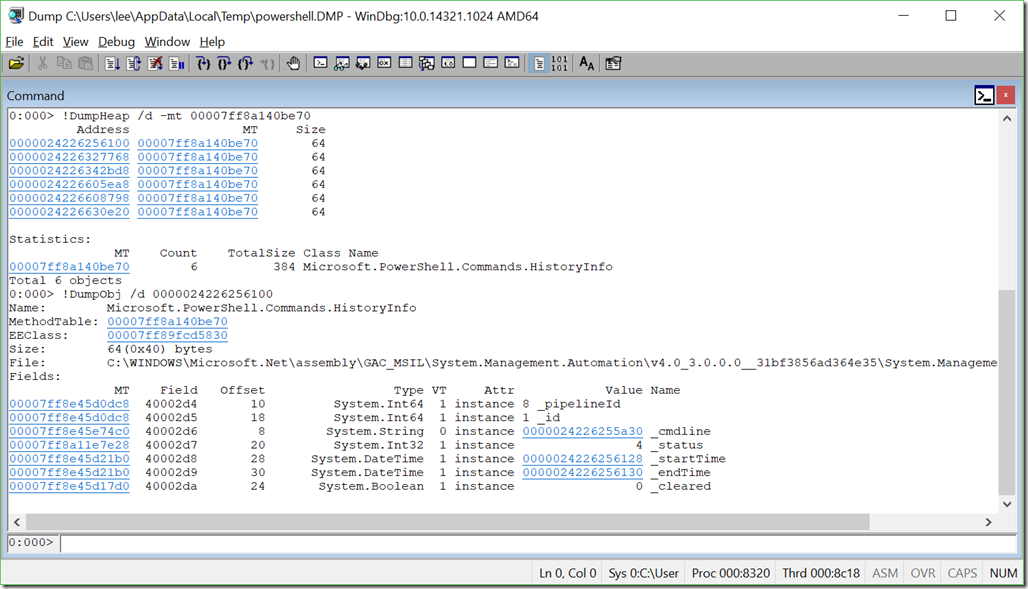
There’s a string at offset 8 that contains the _cmdline itself. What’s in it? You can click (!DumpObj /d 0000024226255a30) to find out.
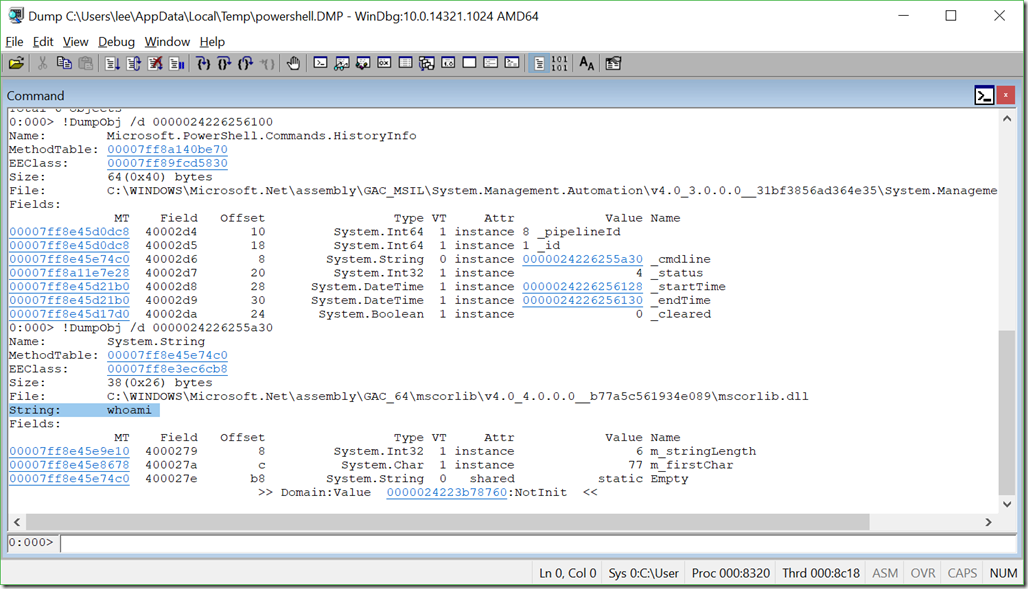
Ah, yes. The eternal existential question. Who am I?
Doing this manually for each HistoryInfo can get annoying, so you can use WinDbg’s “scripting language” to automate some of it. The “.foreach” statement lets us iterate over debugger output, assign each item to a variable, and then act on that variable. So here’s a little recipe we’ll run:
.foreach (historyinfo { !dumpheap -type HistoryInfo -short }) { .echo ${historyinfo}; !DumpObj poi(${historyinfo}+8) }
We’ll iterate through the !DumpHeap results, assigning each memory address to a ‘historyinfo’ variable. We’ll echo that original memory address to the screen, and then remember that the _cmdline was offset 8 from that memory address. So, we’ll use the poi function to calculate the address of that new object, and use !DumpObj to dump it.
That gives us a bunch of output that we can then review, or script even further.
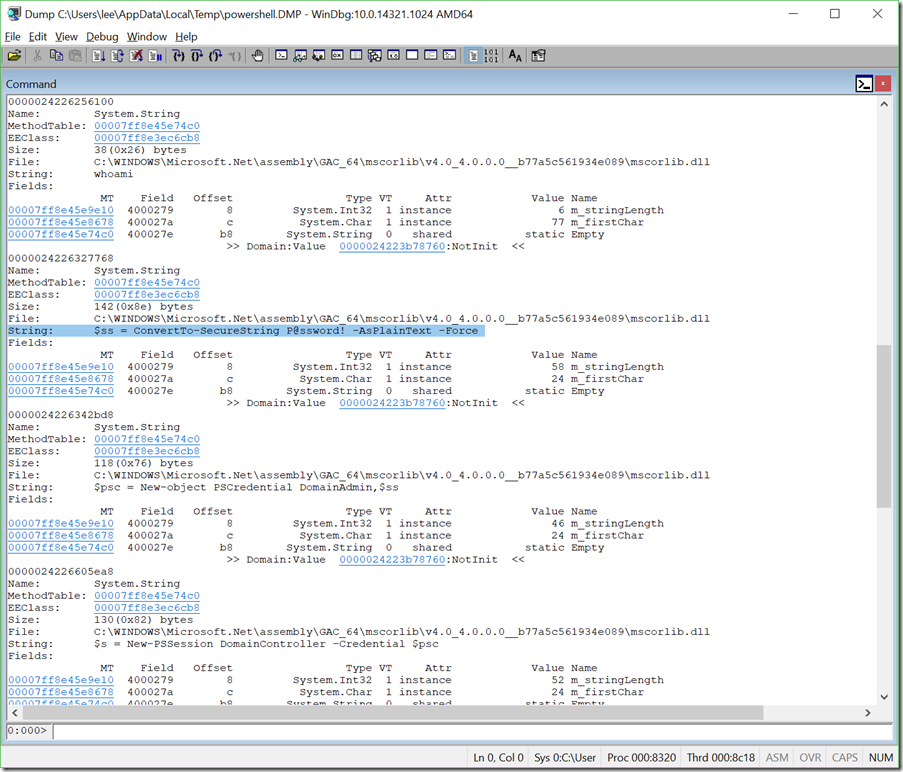
In our forensic analysis of this image, we can see that we are in trouble indeed. After they ran ‘whoami’, they knew the username and password of the Domain Admin, and then used PowerShell remoting to connect to the Domain Controller with it.
Automation
User interfaces are great for initial analysis, but terrible for scale. To automate scenarios like this, you can use this WinDbg Automation module I shared a little while ago. It leverages cdb.exe – the console version of WinDbg. From there, you can do all kinds of crazy stuff.
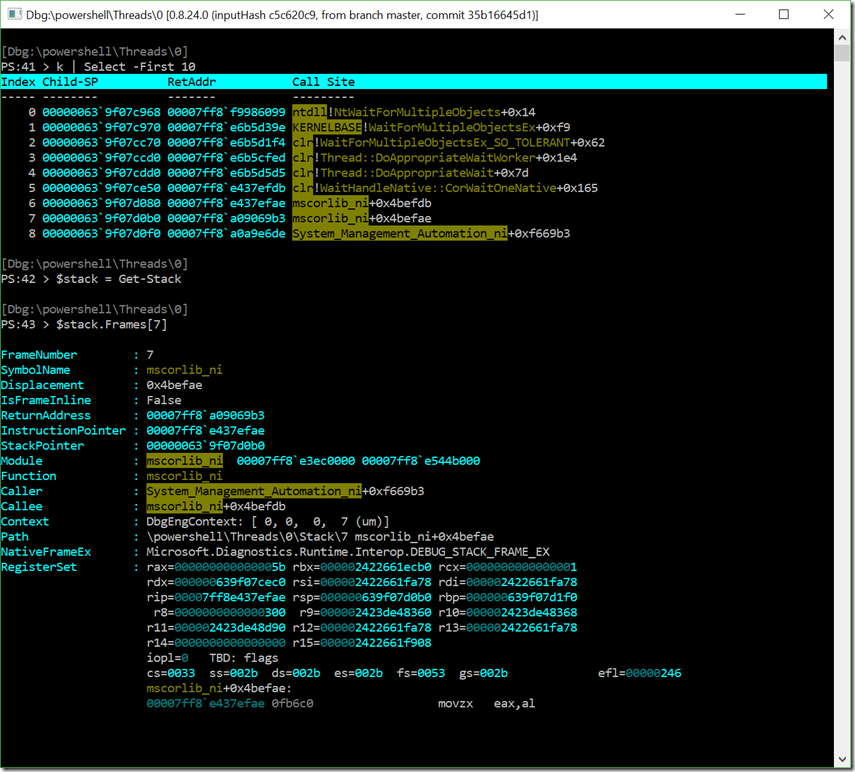
As cool as that module is, I’m most excited by far about the recent open sourcing of DbgShell. This is the hobby-time project of @JazzDelightsMe, and exposes much of the debugging engine into PowerShell as PowerShell objects. Incredible!
